class: center, middle, inverse, title-slide .title[ # Phase II: Using Our Toolbox ] .subtitle[ ## Module 5: SHARK! ] .author[ ### Dr. Christopher Kenaley ] .institute[ ### Boston College ] .date[ ### 2024/10/4 ] --- class: inverse, top # In class today <!-- Add icon library --> <link rel="stylesheet" href="https://cdnjs.cloudflare.com/ajax/libs/font-awesome/5.14.0/css/all.min.css"> .pull-left[ Today we'll .... - Review WCR5 - Working in `geomorph` - the good - the bad - the ugly - Principle Components Analysis ] .pull-right[  ] --- class: inverse, top <!-- slide 1 --> ## WCR5 .pull-left[ - Code: Copy and paste is ok, just know what it's doing - Staying on task ] .pull-right[ ``` r xy <- read_csv(f,id="file_name") %>% group_by(file_name) %>% mutate(point = 1:n()) ``` ] --- class: inverse, top ## Working in `geomorph` .pull-left[ - Hugely influential - 2000+ citations - One stop shopping: - digitization/landmarking - superimposition (GPA) - analysis (PCA, comparative methods) - visualization (plotting) - Landmark analysis based on non-intuitive arrays ("p x k x n") - Functions not always pipe (`%>%`) friendly - Graphical outputs use base graphics (ugly) ] .pull-right[ ``` r print(plethodon$land[1:3,,1:2]) ``` ``` ## , , 1 ## ## [,1] [,2] ## [1,] 8.89372 53.77644 ## [2,] 9.26840 52.77072 ## [3,] 5.56104 54.21028 ## ## , , 2 ## ## [,1] [,2] ## [1,] 8.679762 54.57819 ## [2,] 8.935628 53.83027 ## [3,] 5.451914 54.65691 ``` ] --- class: inverse, top ## Working in `geomorph` .pull-left[ - Hugely influential - 2000+ citations - One stop shopping: - digitization/landmarking - superimposition (GPA) - analysis (PCA, comparative methods) - visualization (plotting) - Landmark analysis based on non-intuitive arrays ("p x k x n") - Functions not always pipe (`%>%`) friendly - Graphical outputs use base graphics (ugly) ] .pull-right[ ``` r plethodon$land %>% gpagen(verbose = F) %>% plot() ``` <!-- --> ] --- class: inverse, top ## Working in `geomorph` .pull-left[ - Hugely influential - 2000+ citations - One stop shopping: - digitization/landmarking - superimposition (GPA) - analysis (PCA, comparative methods) - visualization (plotting) - Landmark analysis based on non-intuitive arrays ("p x k x n") - Functions not always pipe (`%>%`) friendly - Graphical outputs use base graphics (ugly) ] .pull-right[ Try this . . . ``` r plethodon$land %>% gpagen() %>% gm.prcomp() %>% plot() ``` ] --- class: inverse, top <!-- slide 1 --> ## PCA .pull-left[ - Reduces dimensions of data - 10s, 100s variables into components - Iterative - "draws" vectors through original data - each successive vector represents a component of decreasing variance ] .pull-right[ 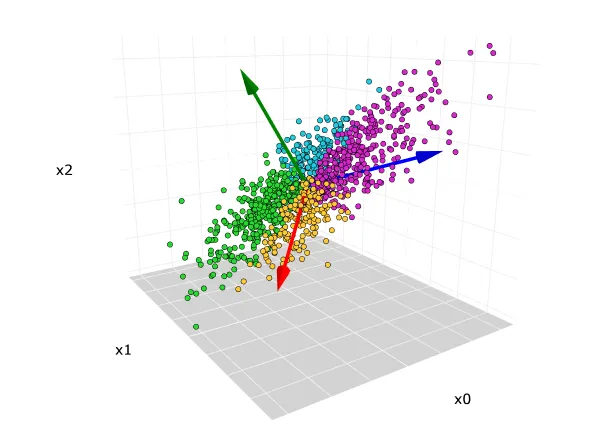 ] --- class: inverse, top <!-- slide 1 --> ## PCA .pull-left[ - Reduces dimensions of data - 10s, 100s variables into components - Iterative - "draws" vectors through original data - each successive vector represents a component of decreasing variance ] .pull-right[ 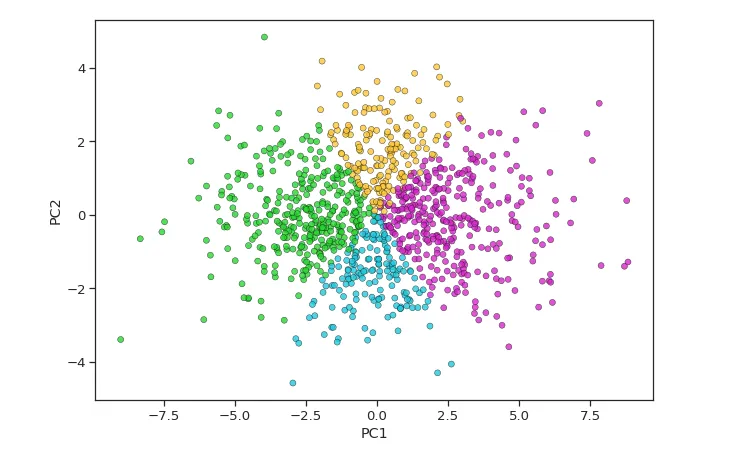 ] --- class: inverse, top <!-- slide 1 --> ## PCA .pull-left[  ] .pull-right[  ]